
Page 57 - Glass Machinery Plants & Accessories no. 2-2020
P. 57
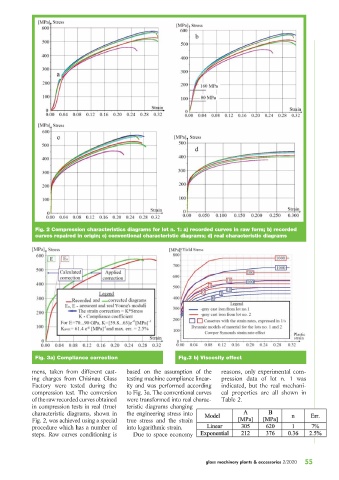
Fig. 2 Compression characteristics diagrams for lot n. 1: a) recorded curves in raw form; b) recorded
             curves repaired in origin; c) conventional characteristic diagrams; d) real characteristic diagrams


             Fig. 3a) Compliance correction                     Fig.3 b) Viscosity effect

            mens, taken from different cast-  based on the assumption of the   reasons, only experimental com-
            ing charges from Chisinau Glass   testing machine compliance linear-  pression data of lot n. 1 was
            Factory were tested during the    ity and was performed according   indicated, but the real mechani-
            compression test. The conversion   to Fig. 3a. The conventional curves   cal properties are all shown in
            of the raw recorded curves obtained   were transformed into real charac-  Table 2.
            in compression tests in real (true)   teristic diagrams changing
            characteristic diagrams, shown in   the engineering stress into
            Fig. 2, was achieved using a special   true stress and the strain
            procedure which has a number of   into logarithmic strain.
            steps. Raw curves conditioning is   Due to space economy


                                                                         glass machinery plants & accessories 2/2020  55